Your Paths to Success in your Career
04-Jan-14 1 Comment
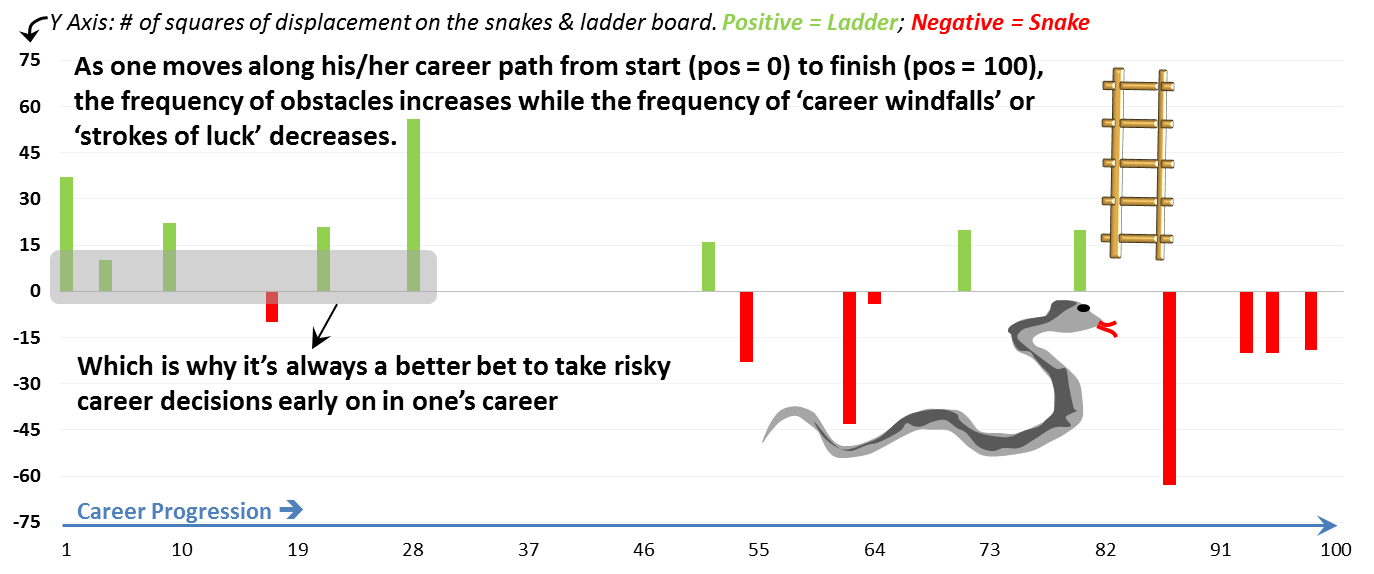
This is how some people plan their careers:

This is what actually happens:

04-Jan-14 1 Comment
This is how some people plan their careers:
This is what actually happens:
28-Dec-13 Leave a comment
Some time during the last few days have been spent in looking up housing finance companies that lend to the growing lower income urban population of India. According to a report by the Technical Group (11th Five Year Plan) on Estimation of Urban Housing Shortage, there is a whopping 99.9% shortage of affordable housing for the economically weaker sections of India. The folks who maybe just have one bank account, are aware of insurance but mostly aren’t insured, aren’t required to pay taxes and may not be very educated are the customers of this industry. Gruh, CanFin, Repco, LIC Housing, Dewan, Sahara etc are names that come to mind. First the names that were discarded:
The two that slipped through and have managed to wedge into my consciousness:
Chartistically speaking, while Gruh seems to have broken out of its resistance that was established at the start of 2013, Can Fin is getting close to it’s resistance level of 180. So I wouldn’t bite unless the prices come down. The problem is the high opportunity cost of sitting out of these opportunities if the expected corrections don’t happen. I think I am being greedy for no reason…
17-Dec-13 Leave a comment
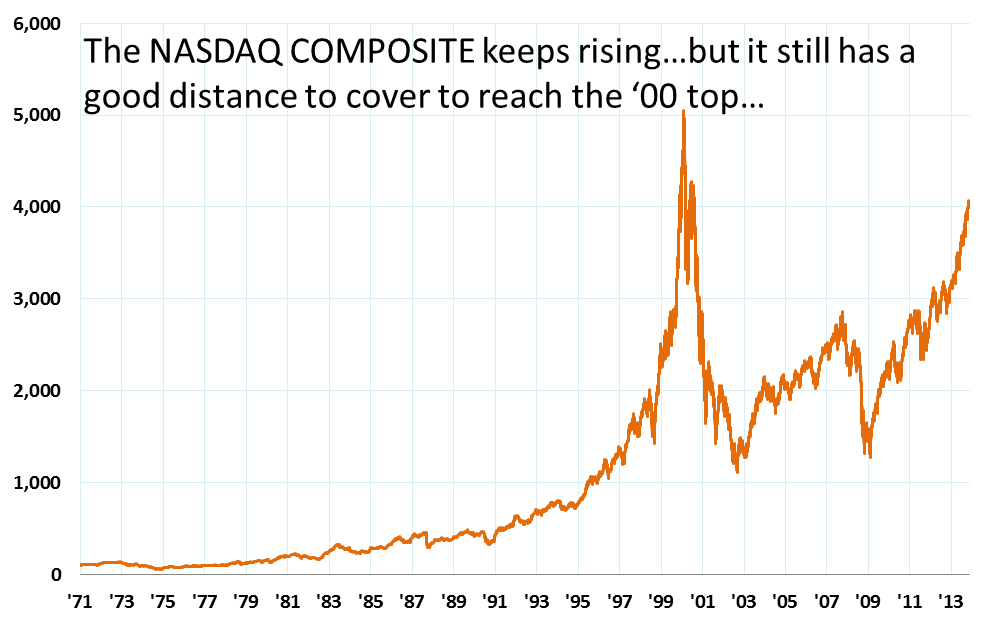 Will the US market ever pause and think? It’s been rising continuously since 2009 with maybe 4 – 5 good sized corrections thrown in for the sake of good order. I think it’s important for its own sake that the market stops and gives us a nice juicy correction. No one for sure knows when it’ll happen, but a significant correction does look probable one day or the other (as probable as the death that awaits us!). This seemingly parabolic rise (y = a * x^2) of the NASDAQ Composite since the past 4 years requires energy for sustenance – which we know has provided by the various strains of the QE program till now. The second chart here is telling – it compares the rise of the NASDAQ composite with our desi NIFTY (the latter quoted in USD) – i.e. the
 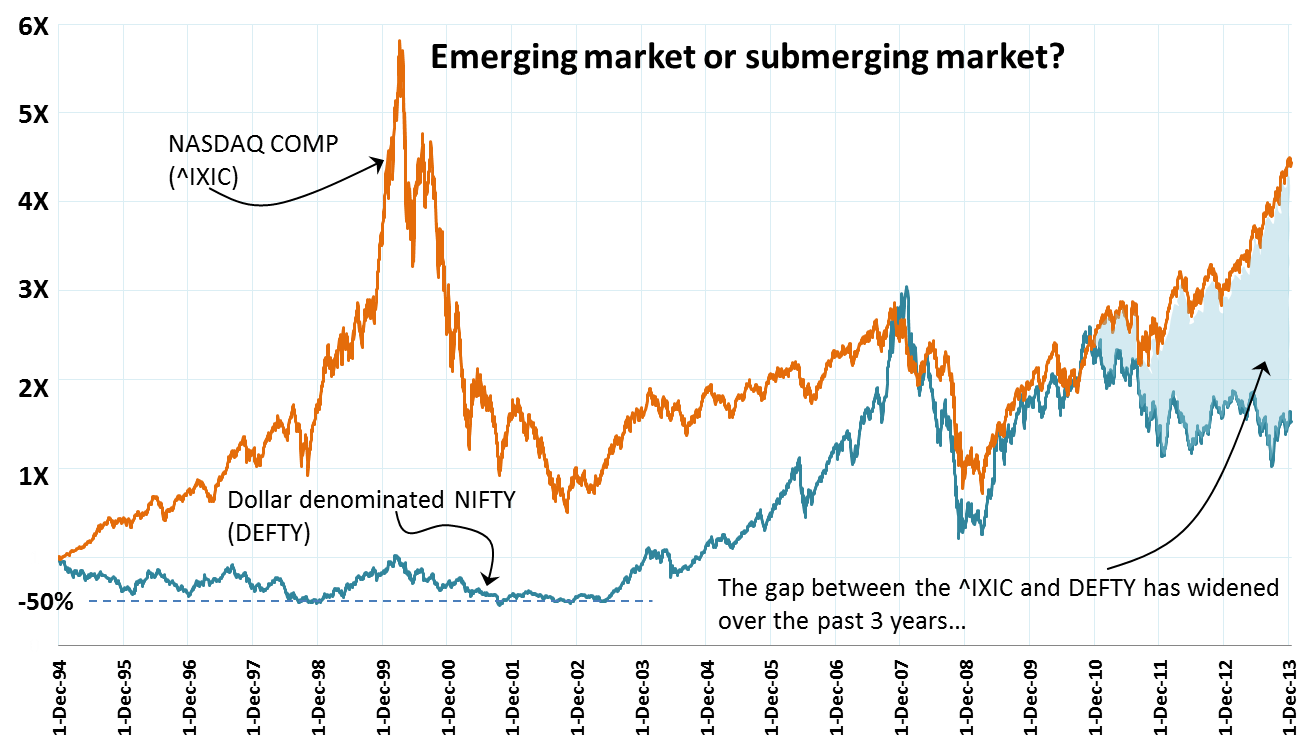 DEFTY. It’s important to compare against the DEFTY since the fx related variances are removed. Stating the NIFTY in USD is also important to see the impact that the QE has had on the
 emerging submerging world. The QE has effectively ‘exported’ inflation to the emerging world.
Here’s a link to an article that inter alia contains a beautiful chart on the QE program and explains how the QE now seems to be becoming quite the drag on the US GDP and long term rates than before. So is it a good idea to prepare for the inevitable and be in cash?
Barry Ritholtz discusses a perplexing slice of affluent Americans’ wealth pie that’s worrying them: cash! Are they worried because there is a raging bull market in equities next street? Or are they worried because earnings of companies are increasing? Since when did that become a cause for worry? While I am not an affluent American by any stretch of imagination, this does apply in my case as well. 🙂 I am way too much in cash these days than what the doc prescribed. Yes, I know I am losing money by the minute and I am aware of things like fixed income and its ilk (fixed maturity plans, tax free bonds, etc.) but somehow I have not been able to move myself to lighten my burden. It’s like a sack of sand with a hole at the bottom. The burden does get lighter given the hole called inflation. I have even been called by the “relationship  managers” of the bank I use and have been lectured on the demerits of keeping cash in the portfolio. To my credit, I listened patiently. But haven’t acted on the tip!
Is being a deer that’s stuck in the headlights a bad thing? I guess it is. Searching for an idea that could be a good use for the cash I have. Waiting for Godot, it seems I am.
13-Dec-13 Leave a comment
This has been a pretty good trade and I guess it’s time to unwind now. I am never good with breakouts and get extremely edgy at the top – it runs counter to how many momentum people think and act but I think I suffer from vertigo. This is lucky cause I had no clue what the Shipping Corporation of India (SCI) has been doing or is about to do. I later on realized that they are in the doldrums and are getting rid of their “Black Pearl” and their attempts to raise prices are getting whooped by competition. No wind in their sails, so to speak. The pearl bit is not off the mark given that SCI is in danger of losing its “Navaratna” status – whatever it means. I am no Jack Sparrow. I entered when I happened to see the Baltic Dry Index (BDI) spike up at end Sep. I had no clue about the differences between spot contracts and forward contracts rates and the billing mix for SCI. All that wisdom comes in hindsight!! In this case it has been pure luck. 🙂
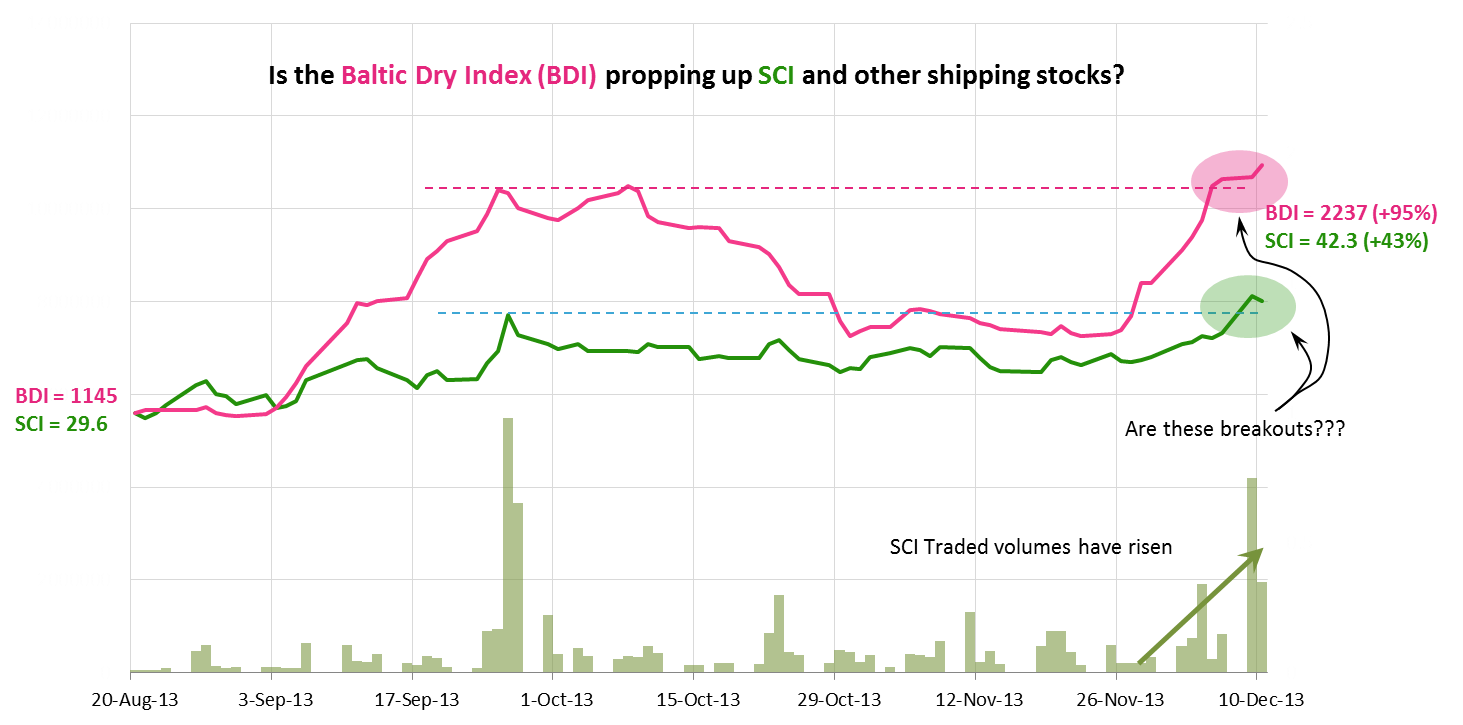
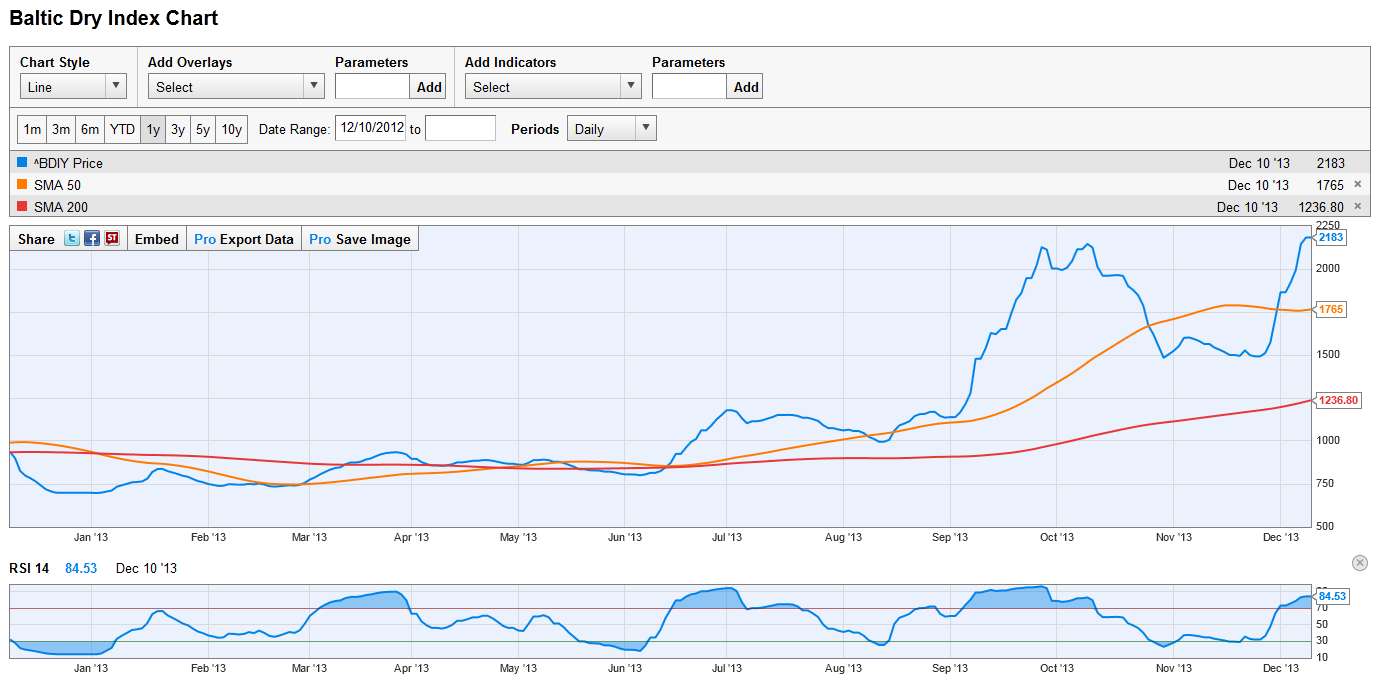
The BDI technical chart (via ycharts.com) looks overbought to me. I may be wrong and I guess breakouts are all about RSI remaining in elevated levels, but when you get some gains on pure luck and nothing else, I don’t believe in “letting the profits run”. 😉
11-Sep-13 1 Comment
A Venn to ponder on. What do you think? This just came to my mind when I was preparing for a meeting today:

26-Jul-13 3 Comments
I read an article in The Financial Express of yesterday about the measues taken by the RBI and a couple of other agencies to halt the rupee’s decent and constructed the following infographic.

16-Jul-13 2 Comments
What an u turn we have seen – of people of all manger of expertise who once extolled the decoupled state of Indian economy during the erstwhile “India Shining” days who are now weighing in with stories of markets being joined at the hip! Local stories do little to educate on what is happening and is going to happen (!) in our local markets. Most local commentators worth their salt correctly look to charts of the SPX, USD, credit in the US etc. as reliable portends of the shape of things to come. The de-couplers of past were certainly wrong – they ignored the big glue that sticks us (and other emerging economies) together with the rest of the birds flying at the head of our skein. That glue, is undoubtedly the currency exchange rate. Take a look at the comparison of the NIFTY vs the DEFTY chart below. I have also charted the ratio of DEFTY over NIFTY – since 1994 each unit of NIFTY is getting you progressively lesser and lesser quantities of DEFTY, indicative of a massive squeeze on the INR.


The human eye searches for patterns where there ought to be none! My untrained eye seems to suggest a great support at 3,000 on the DEFTY. We are ~3,350 currently, so a nice 10% correction would get us there. Possible? I don’t think any expert would be foolhardy enough to put a zero probability for that happening. So, either the INR rises in the immediate term or the market falls on disappointing results or both happen to get the DEFTY down to this level. But yes, as far as patterns and psychological levels of supports go, the 3k mark does provide a nice breather.
 So if you are trading, the USD:INR is obviously a huge factor to consider. The graph on the right plots the correlations between N day returns (on a given day) and the immediately following Nth day return. The blue line is for the NIFTY N day return correlations while the red line shows this relationship for the DEFTY. For positive value of correlation coefficients, one can expect that given a positive (negative) N day return, the next N day return will also be positive (negative) – i.e. the tendency for the trend to continue. Both the NIFTY and DEFTY data suggests that this correlation peaks at N = 10, implying that given a 10 day trend, it is most likely that the following 10 day period will stay true to that trend. The point here is that from an overseas investor perspective, the relationship is more pronounced as compared to the internal view. NRIs are raking it all in!! Hopefully some of them will fill our reserves with their precious FCY and buy houses here.
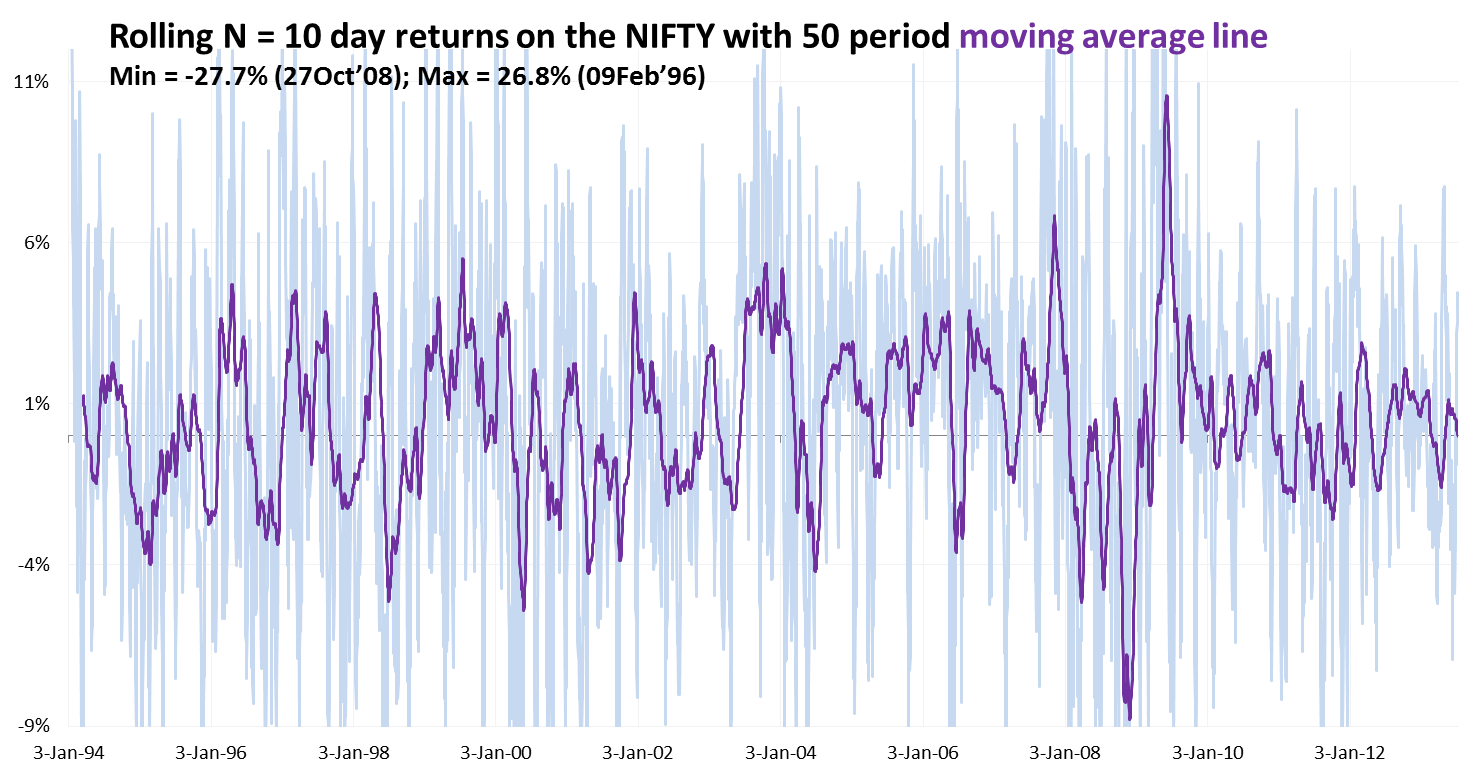 Please note – this is median behavior, the N day returns are likely to show a normal distribution with some really fat tails (9/11, bombing of Parliament, Lehman event, etc.). the chart below shows the rolling 10 day return on the NIFTY over time and its 50 period moving average line. The outliers (i.e. the fat tails of the N = 10 day return normal distribution curve) are as high at 26.8% on the positive side and as low as 27.7% on the negative side!! Shouldn’t trading be an Olympic sport?
03-Jul-13 Leave a comment
 University Grants Commission’s National Eligibility Test is one entrace exam that I would never be able to crack however hard I tried. This exam is taken by candidates who are keen to land university level teaching jobs or secure junior research fellowships in universities. Inter alia, the most recent iteration of the exam that was conducted last weekend contained questions like:
At primary school stage, most teachers should be women because:
a) can teach children better than men
b) know basic content better than men
c) are available on lower salaries
d) can deal with children with love and affection
🙂
The exam (for university teaching posts) was first rolled out in 1989 after considerable delibration on the poor quality of individuals being selected in the teaching profession. If the above is the standard of the questions being asked, I wonder how is the exam living up to it’s billing. Given that 13,000 candidates took the test last weekend, would such questions differentiate talent? Presence of such absurd and silly questions seems to be one of the reasons why the cut-off marks is in the range of 55% – 65% (depending on your ‘category’). On top of that there is an awesome amount of mismanagement of results and the examination has seen it’s share of controversies and dharnas and protests. There have been candidates who have scored lesser than the stated cut-off threshold yet have been selected!! Aren’t we cool?
30-Jun-13 1 Comment
 I’ve written about my position in Gitanjali Gems earlier (here, here and here). If you go back to those posts, you’d see how I’d likened that stock’s ascent to a Diwali rocket. I guess the sad truth is that now the rocket having spent it’s glory in a sparkling display of fireworks is now descending to terra firma in tattered parts. Bearish international reports on gold must have induced some FIIs to sell off tipping the cart. Given that the June expiry was neigh, brokers seem to have stumbled triggering margin calls to fund leveraged positions that were rapidly turning out of money. Poor people like me can only pontificate and sagely philosophize that apart of 1/3rd of their sales coming from low margin gold sales, nothing much is wrong with the business model of the company. Once the churn is over, the stock will resume it’s upward climb. My position is still in the money since I was sitting on an almost five bagger on this one. I feel like a complete ass however – there was a good deal of time to act between the finmin’s announcement to increase import duties on gold and the stock tanking. If I really am a long believer in the scalability of the retail and Bollywood advertising (therefore costly!) driven sales model of Gitanjali, could I not have sold at around the top (not as a deja vu moment, but as a result of a logical reaction to finmin’s tightening of the Indian gold scene)??? Things are always easier said when in hindsight, but this one I genuinely regret. I do remember thinking about this a couple of times and dismissing the thought telling myself that they mostly sell jewellery and not gold, so shouldn’t be a problem. I hadn’t bothered to check inventory unfortunately. And therein lies the rub. 😦
 The other stock that I have been staring at for quite some time this weekend is that of Tata Coffee. I mean since when have better known counters started dislaying a pattern that looks like a square wave? remember all those electronic waveforms – saw tooth (quite common in Indian markets), sine wave (maybe long term commodity plays show this – haven’t checked) and now this square wave, like the 555 timer output waveform!! This Grand Canyonish stock chart also seems to suggest of brokerage firms triggering massive scale sell offs due to margin pressure on their client positions. It may not be related with the global price of coffee at all. Thinking if this is a cup to sip at all – not personally in the mood to do any research about the stock.
Followup post on Tata Coffee:
– you may be aware of this, but I wasn’t. Kotak Mahindra Prime, one of the largest institutional investors into Tata Coffee sold a big deal as did one individual investor.
– this again triggered some margin calls and ergo the price is now really lying low.
– if it falls a little bit more – say 935 – 950, it might be a good position to take.


Recent Reactions