Desperate Measures to Arrest the Rupee’s Slide

I read an article in The Financial Express of yesterday about the measues taken by the RBI and a couple of other agencies to halt the rupee’s decent and constructed the following infographic.

India Controls to Stem Rupee's Slide

The Rupee Squeeze

What an u turn we have seen – of people of all manger of expertise who once extolled the decoupled state of Indian economy during the erstwhile “India Shining” days who are now weighing in with stories of markets being joined at the hip! Local stories do little to educate on what is happening and is going to happen (!) in our local markets. Most local commentators worth their salt correctly look to charts of the SPX, USD, credit in the US etc. as reliable portends of the shape of things to come. The de-couplers of past were certainly wrong – they ignored the big glue that sticks us (and other emerging economies) together with the rest of the birds flying at the head of our skein. That glue, is undoubtedly the currency exchange rate. Take a look at the comparison of the NIFTY vs the DEFTY chart below. I have also charted the ratio of DEFTY over NIFTY – since 1994 each unit of NIFTY is getting you progressively lesser and lesser quantities of DEFTY, indicative of a massive squeeze on the INR.

NIFTY vs DEFTY Jul13DEFTY per NIFTY unit

The human eye searches for patterns where there ought to be none! My untrained eye seems to suggest a great support at 3,000 on the DEFTY. We are ~3,350 currently, so a nice 10% correction would get us there. Possible? I don’t think any expert would be foolhardy enough to put a zero probability for that happening. So, either the INR rises in the immediate term or the market falls on disappointing results or both happen to get the DEFTY down to this level. But yes, as far as patterns and psychological levels of supports go, the 3k mark does provide a nice breather.

Corr Coefficients N day returns vs next N day returnSo if you are trading, the USD:INR is obviously a huge factor to consider. The graph on the right plots the correlations between N day returns (on a given day) and the immediately following Nth day return. The blue line is for the NIFTY N day return correlations while the red line shows this relationship for the DEFTY. For positive value of correlation coefficients, one can expect that given a positive (negative) N day return, the next N day return will also be positive (negative) – i.e. the tendency for the trend to continue. Both the NIFTY and DEFTY data suggests that this correlation peaks at N = 10, implying that given a 10 day trend, it is most likely that the following 10 day period will stay true to that trend. The point here is that from an overseas investor perspective, the relationship is more pronounced as compared to the internal view. NRIs are raking it all in!! Hopefully some of them will fill our reserves with their precious FCY and buy houses here.

Rolling 10 Day Returns NIFTYPlease note – this is median behavior, the N day returns are likely to show a normal distribution with some really fat tails (9/11, bombing of Parliament, Lehman event, etc.). the chart below shows the rolling 10 day return on the NIFTY over time and its 50 period moving average line. The outliers (i.e. the fat tails of the N = 10 day return normal distribution curve) are as high at 26.8% on the positive side and as low as 27.7% on the negative side!! Shouldn’t trading be an Olympic sport?

Petrol on a Roll

Economic medicine that was previously meted out by the cupful has recently been dispensed by the barrel. These once unthinkable dosages will almost certainly bring on unwelcome after-effects. Their precise nature is anyone’s guess, though one likely consequence is an onslaught of inflation.
Warren Buffet

I did some number crunching and came up with the chart on the right. It shows the movement of the price of a liter of petrol in INR (stepped blue line) vs. it’s price in equivalent dollar terms (red line) over the past 10 years. The price of petrol in equivalent USD terms has always been  higher than the local retail price except during Jan – Feb ’09. Petrol pricing strategy seems to rely on ‘fixing’ the retail price of the fuel so as to minimise the tracking error against the red line. I constructed this chart to test this exact same hypothesis – point being that the red line is indicative of what the Indian refiners have to pay, in USD, for buying crude oil from the international markets. The blue line is obviously indicative of the revenue they get when they sell it to Amar, Akbar and Anthony. So the gap between the red line and blue line essentially indicates the subsidy burden that the Indian economy and therefore what AAA (the three gentlemen above) have to bear via taxes.

Also, between the INR:USD exchange rate and the petrol price, the latter is the dependent variable, i.e. exchange rate causes petrol price policy. This also comes out through the tracking movement of the blue line vis-a-vis the red line in the chart above. I doubt if all get this – many think that recent petrol price hike will help arrest the recent fall of the INR. Well, nothing like that happened today. Most people also think that the RBI can intervene to control the INR. The fact is that the INR fx market is too large for the RBI to control anymore. We are living in very different times from 10 years ago [ref: these excellent articles by Ajay Shah. click here and here].

Now, what’s interesting with this recent hike is that it has happened at a time when the global price of Brent crude has been in a continuous fall since April this year! So India has increased its retail petrol prices despite a near 20% drop in the global price of oil! Reason being that while global crude oil prices fell by 20%, the INR dropped a similar amount in the same time thereby negating any benefits that could have accrued due to a lower oil import bill.

Also wanted to jot down the observation that the quantum of the recent blue line spike (i.e. price hike) is very high indeed. Maybe the Government had anticipated massive opposition to the move and hiked a lot so that they can roll back a partial amount to appease the insulted. Or it could be that Finance Ministry is seeing the INR go down to 60 soon and therefore have announced a one time whopper of an increase. I do not know what’s behind me but my chart certainly points to an anomaly – i.e. the blue line troucing the blue line by such a wide margin – perhaps for the first time in the past 10 years. Whatever be the explanation, the chart makes it quite clear that we live in exceptional times today and that all manner of caution and discretion is advised especially when allocation your capital to your ideas.

Incidentally, I am wondering if I should increase my ‘work from home’ days given that the price of petrol in Hyderabad has risen from 65.15 (16Jan’11) to 80.58 (24May’12) representing a 17% annualized increase. The only two major cities where petrol is more expensive than Hyderabad are Jallandhar (80.68) and Bangalore (81.01). Petrol remains lowest in Goa at 68.51, but even there, as in all Indian cities, beer is cheaper than petrol!! Cheers.

Greece

If this is Greece, what lies beneath? WYSINWYG. The one piece of ice that’s been drifting around very closely to this beast is Turkey. They should have included it in the Euro zone when things were good. Now, I doubt if the Turks will ever swim close to this thing. Cold Turkey, really. Incidentally, which is the country with the highest per capita holdings of gold? China? India? Greece? Its Turkey. China & India’s consumption may be high but Turkey’s growth in consumption is staggering – according to the World Gold Council, demand rose by 32.6% in 2011 compared to the previous year. Both their government as well as the people there are worried about the future. So while many emerging counties’ central banks are loading on gold as a hedge against inflation that the US Fed exports out to them, India seems to be a little bit too big to do that. Lots of money will be needed to buy more and more of the expensive gold and that would mean printing INR that’s getting cheaper in value (and therefore more costly to print) by the day. Considering that inflation will not be allowed to rise up any more than what it has in the past given we are soon going to be entering into the election year it looks like a catch 22 to me. Is my logic correct?

Global Commodity Prices and the INR

The $CRB index gives global price levels of a basket of commodities and is an important indicator that is watched to get clues on whats happening. The index has been declining of late and this would certainly seem to benefit countries like India that have a whopping oil (and gold!) import bill. However, the INR seems to be playing spoilsport. Any gains from a drop in global commodity prices seems to be getting undone by a concomitant drop in the INR. I constructed the below chart to figure out the relative movement of the $CRB and the INR:USD exchange rate. The correlation comes to a high -0.75.

Managed Floats

Jeffrey “King of Bonds” Gundlach was the former head of the $12 bn TCW Total Return Bond Fund. His presentations on the state of whats happening around the economic world are eagerly awaited and discussed. You can find his latest message here. I am showing two screens that caught my eye. These are the lines of movement of the Chinese Renminbi (RMB) and the Indian Rupee (INR).

The INR is on a “managed float” path. Successive administrations at the Reserve Bank of India (RBI) have managed to maintain and further this strategy of not pegging the INR to a particular foreign currency at a particular exchange rate. Earlier, the RBI used to intervene in the currency markets (it still tried its hand very recently), but the growth in recent trading volumes on the INR means that RBI’s intervention will lack any meaningful punch going forward. The INR has therefore moved a little bit closer to full float status. 

The RMB, on the other hand is undergoing a lot of makeovers. It was earlier pegged to the USD at a fixed rate and then in 2005 when the peg was lifted, all the pent up pressure got released and an immediate revaluation took place. However, the peg was unofficially brought back due to the onset of the financial crisis. Then, in Jun’10, China’s central bank said that it will increase RMB’s flexibility. Now it is moving to managed float status. HSBC had earlier predicted the RMB to become the 3rd major world reserve currency in 15 years. That’s a lot of time for a few more makeovers.

Risk Management and Inter Bank Dealings

This will be big news in today’s papers (posting around midnight AM) – RBI’s promulgation of capital controls to reign in the currency movement. There is a meeeting there in the RBI today for a review of its monetary, so some more interesting sound bytes should come out. What if they cut the CRR?

And Ajay Shah provides a contra view to RBI’s action. Boy! If I have to pick between the short term bounce up generated by a possible CRR cut and the medium term lower levels of NIFTY as mentioned in Ajay Shah’s post, I’d pick the latter.

BTW, at one point in time yesterday RBI’s legal tender was quoting at 54.29 times a USD! Can’t believe it. Sort term relief for exporters? Only if they prevent losing their margins to local inflation.

QE2′s Titanic Voyage

The QE2, now moored at Dubai is a magnificent ship. It is an awesome flotilla of human engineering with 5 restaurants, 2 cafes; 3 swimming pools; a pub, a nightclub and several bars; a casino; a 481 seater cinema; shops; health clubs; the largest floating library and a hospital – all comprising an ecosystem of 3000 people (incl full roster of passengers) that circumnavigates around the world in 80 days. Given the cacophony of the other QE2 (Quantitative Easing, proposed & hopefully stillborn Round 2) in the US, I try to compare this Cunard marvel to the US economy. I randomly switch between QE2, the ship and the Fed’s QE2 (the raising of a shipwreck)

I have been absorbing and echoing popular thoughts that the recent Indian market rally has been fuelled by Foreign Institutional Investment (FII) related flows and that once this spigot runs dry, we’ll have a nice juicy correction. A big enough gash to seriously bleed the short term traders. But I never counted on the Fed docks building and launching another armada of liquidity into the markets! The US docks, from this perspective just never seem to run dry. And now I am big time confused. The QE2 rush of dollars will only add fuel to the fire, right? So, will we be seeing a near parabolic rise in Indian equity? Will the Diwali rockets fire up real high this year? You may have noted my aversion to seeing parabolas in stock charts from some of my past posts and the accompanying note that parabolas are not self-sustaining. Good for the Indian Government really – considering the slew of paper that is about to be thrown into the ring.

Like QE2, the American economy moves slowly and consumes a lot. The QE2 reportedly moves a cool 40 – 50 feet per gallon of fuel. That implies a mileage of 3.7 meters per litre of fuel. A snail (if blown up proportionately) will be supersonic in comparision, I guess. Like the ship, the American economy is moribund and is crawling towards what many are calling a recession? The QE2 has been navigated by 23 Captains till date, the Fed on the other hand has seen only 14 Chairmen at its helm. The QE2 was introduced in 1967, the Fed came about in 1913. The Fed Chairmen are quite sticky: like barnacles I guess. The QE2, when it was floating around used to consume 430 tons of fuels per day. My back of the envelope suggests that the US drinks 2.3 million tonnes of gasoline a day. I guess India’s figure is at 100 million tonnes of petrol a year.

The other important point is that the Royal Navy recruited the QE2 in 1982 to serve the original Queen in the Falklands War. Similarily, the Fed Captain is pushing QE2 to prepare for war. Only this time it will be a war that will be played out on the currency screens of traders across the world. We seem to be bracing for a full scale global currency war as the QE2 sets float. The difference being that this new artifact from the Fed is being pressed into service on an already raging sea of liquidity. The voyage around Tierra del Fuego has always been notorious – imagine creating a tsunami on a particularly nasty day aross this southern tip of South America as a solution to taking ships over and around the bend! Davy Jones Locker, surely. That too a man-made artificial tsunami. That’s what the Fed is doing, I think. Raising the waves in the hope that domestic (read US) yatchs, boats, dinghies and sundry canoes will start ‘consuming’ the momentum by hoisting up their sails, revving up their motors, rigging up the tow lines and picking up their sculls. Really? What many think is that nature will always choose the path of least resistance and this extra liquidity will quit the Atlantic and flow down towards more Pacific waters. Whither QE2? What will it achieve if that happens?

And finally one last lesson to pick up from QE2. It’s new owner is the Nakheel Group – an Asian real estate group with diversified interests in asset management, liesure and real estate whose website, just like the QE2 seems to be quite slow. The lesson is that developing nations one day will get tired of having to bear the responsibility of mopping up all of this money that the QE2 is spilling out. Unfortunately, it’s not a cornucopia – it’s really a runny nose. And the virus is catching on fast. Emerging economies will one day realise that they’d be better off buying US assets and directly injecting equity into the US system as opposed to buying the rapidly falling US Dollar. If the US domestic investment does not get kickstarted by this QE2, can foreigners buy mines, companies, set up offices in the US and provide employment directly? Can they, is the other question. Arnold Schwarzenegger is touring Asia to see who can build a high speed train system for California.

 The war is on. We saw two wars around the time the gold standard was abolished and the major countries of that age took it upon themselves to support local inflation by printing currency to fund war. After the dust had settled down,  the US dollar was to be much more than just the national currency of the US. After the gold standard was abolished, the US was at its zenith, unscathed by the World Wars and it took it upon itself to make the USD a truly global medium of exchange. The people managing the USD (the Fed Captains) therefore, theoretically at least had a global responsibility. They still have. The point is that when the Fed does things like QE2, the pain is equally felt everywhere. That is why this unilateral stewardship of the world economy will make the recalcitrant new kids on the block itching to pick up a fight. The rednecks will stolidly hang on to their artifical currency pegs while the boys in blue will stoke up local inflation. Common man will get crushed under the weight of rising prices and a Government might fall.

Additional reading:

  1. A view from Infosys’ Think Flat blog: Will QE2 sail or sink?
  2. A caption that I do not agree with: QE2 to speed triumph of emerging markets

Rupee’s “stable” symbol

It was good to see our currency getting a formal symbol in the midst of all talk and nervousness about inflation. While D. Udaya Kumar scrawls himself into history’s books for designing the symbol, I have my own take on the symbol and what is symbolises. Some people felt that using Devanagiri script is anti-non Devanagiri India and I feel that they are loco. My problem is that Ms. Ambika Soni used the design to explain the underlying stability of the Indian currency. What stability? I am not able to understand. Inflation is running so very high and controlling the currency is like riding (and trying to tame) a wild horse. I am a bit slow in these things.

But what I do know is that some of the factors that determine currency stability are : A) enough liquidity and cushioning in the local banking systems, B) the accompanying political landscape is stable, C) inflation is under control, D) legal systems are strong. If these ingredients are not in synch, the currency may topple over. Since symbols represent the inherent qualities of a currency and since the currency is a barometer of the strength of an economy, let’s use reverse logic to check if the chosen symbol for the INR does indicate stability. Let’s at least check if the symbol chosen for the INR is stable in the first place. We’ll might also take a look at the stability factors of the major world currencies while we are at it.

The concept of center of mass, borrowed from physics indicates the center of any shape, however weird it may be. If you make a 3 dimensional solid out of any basic shape, such a shape should be able to spin around it’s axis – and keep spinning if friction were absent. In the real world, friction and restraining forces constantly act on physical bodies. Let’s examine each major currency symbol (click on symbol to magnify), as if it’s 3 dimensional figure were standing on the world platform and see how it respondes to forces of inter-country friction, asset bubbles, financial profligacy, etc – all being represented by the testing forces of friction (cost of being a world currency on the world platform) and gravity.

JPY GBP INR USD EUR
Stable. But one nudge and it’ll topple over left or right – i.e. to China or the U.S.A Very stable!! Stodgy and just may not budge. Won’t be able to withstand it’s own weight. Will topple over 
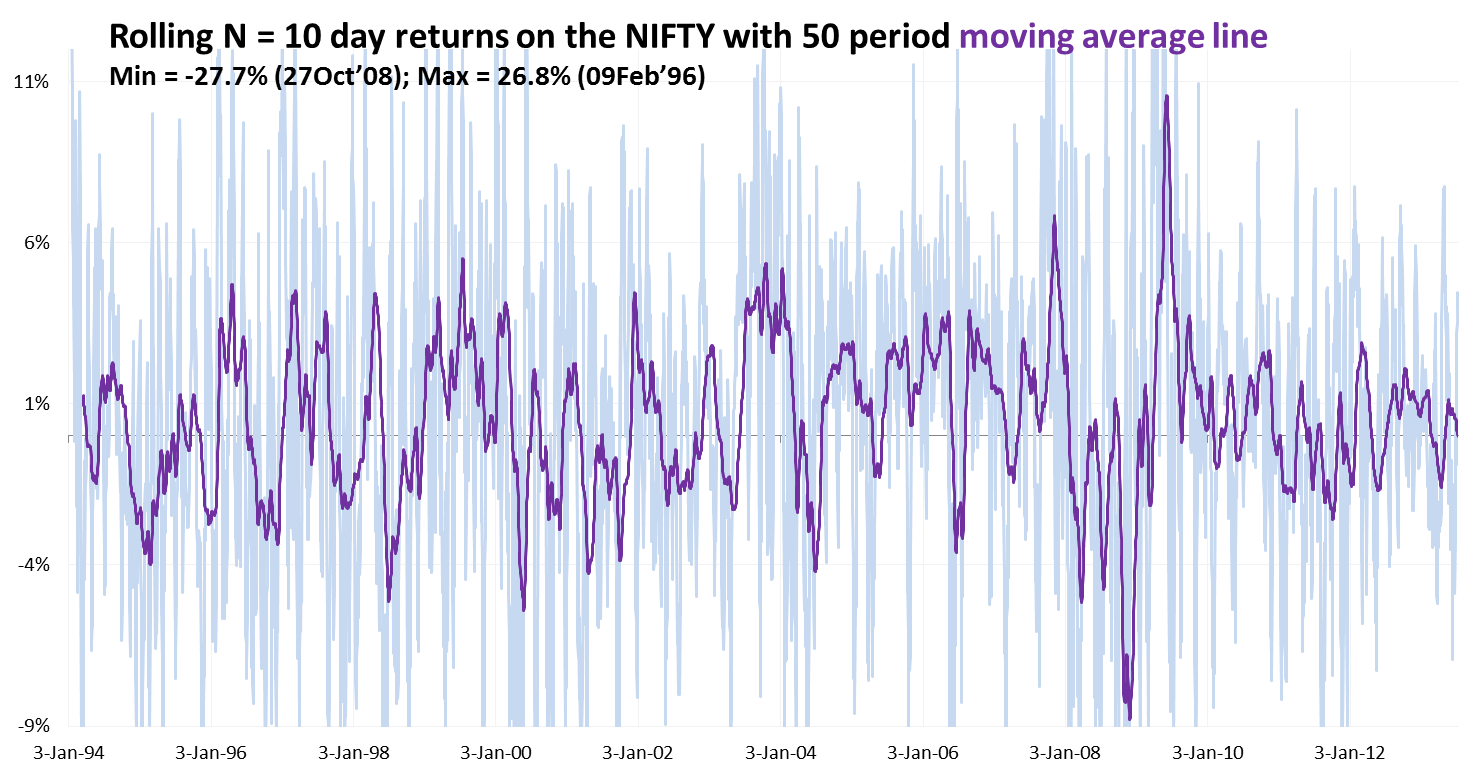
Stable. But one nudge and it’ll topple over. Already fighting it’s 200DMA Will fall down right. If only the horizontal railroads began from further left.

I recommend that you do not take such advise when initiating positions on currency movements! BTW, you don’t have to be a financial whiz kid or a professional trader to initiate positions in world currencies. Just your decision to take up a job in India’s software industry makes you terribly short on the INR. 

Anyway, I like the symbol – whether it is stable or not. I like it since the Big B has requested that it be featured in the logo of the next edition of his show – KBC. I like it despite the fact that it looks like a bastard child borne out of the union of the Devanagiri Ra and the Latin R. I like it despite the fact that it gave me a kink in the neck. I wanted to see if there is some Dan Brownish hidden symbolism in it’s meaning. I craned my neck up and down, held up my laptop at weird angles for that aha! moment but all I got was a sprain in my neck. See, there is massive hidden meaning in the symbol of the EUR. What happens when you tilt the EUR by 90 degrees? You get something similar to this! Hinting at the intrigue and various games that the continent has always been a stage for. Then there was that story of the WTC attack being foretold in a USD 20 dollar bill.

Actually, if you are lean that way and incline yourself physically that way as well, you might just spot this in our currency symbol. Hardly something to associate free capitalism with! 🙂

But considering the fact that cigarettes, tulips, spices, cows, et al have all served as good currencies in the past, I do not think we should have any problem with this tilted masterpiece.

Symbolism apart, the real concern that should play on the minds of our policymakers is the runaway inflation that’s on us at the moment. I was in Mumbai over the weekend and just could not believe the amount I had to pay for just 250 grams of okra, a kilo of tomatoes, a suspicious looking floret of cauliflower. Around a 100 INR! Prices of food and related stuff are increasing @ 20% per annum. So are costs of education and medicine. Eating out has become crazily expensive. So, what I am saying is that the INR is not fiat currency. Far from it. Just that inflation is making things difficult. Very difficult. And the people in charge need to change many more things than just the symbol of the INR.

Did you know that the Vietnamese currency is known as the Dong? And that frugal Vietnamese women really know how to stretch one to the hilt? 😐 The symbol for their currency looks a bit sexual as well.

%d bloggers like this: